
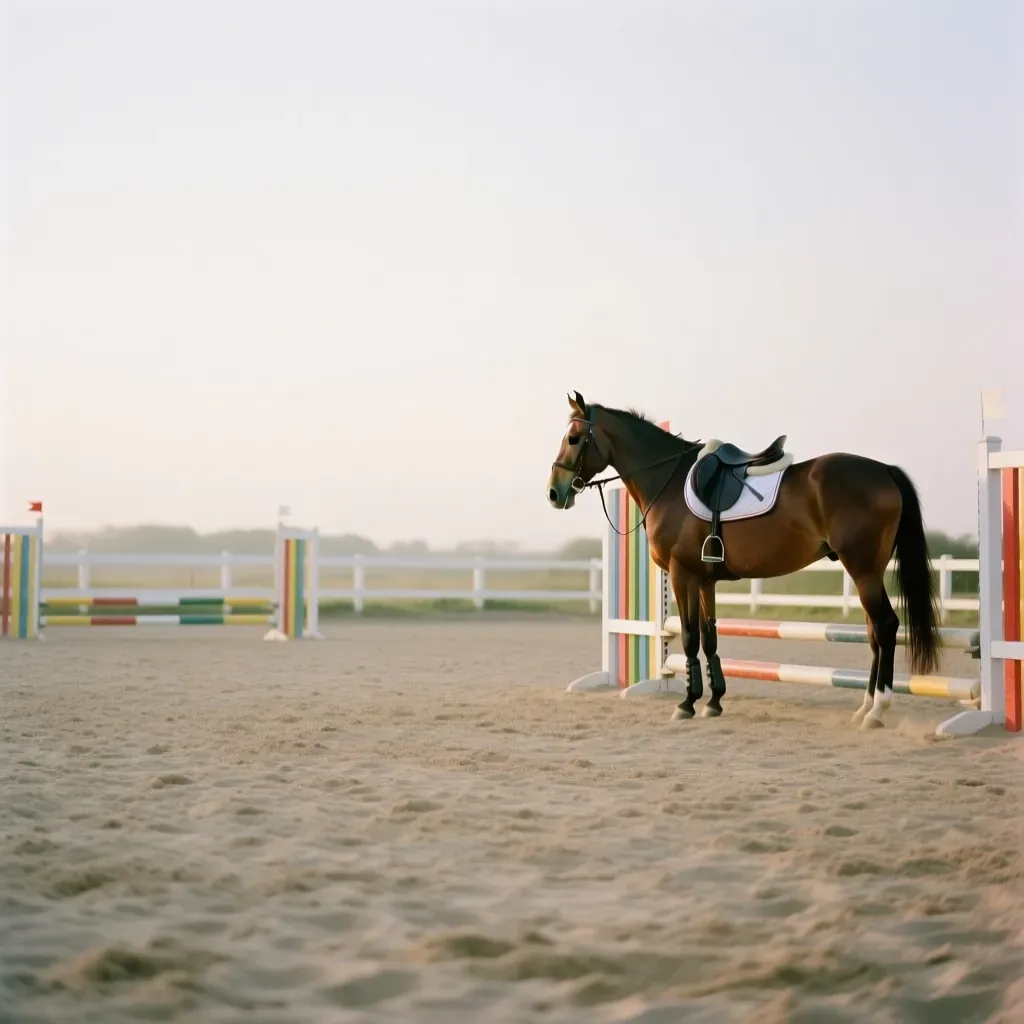
 Equestrian, by Orma Logbook
Your riding.
The penalties and time of each show jumping course, the percentage of each dressage test, your marks figure by figure, the points of each TREC event, your endurance rides, all of it horse by horse. In a logbook that holds your other sports too.
Get it on Google Play Coming soon to the App Store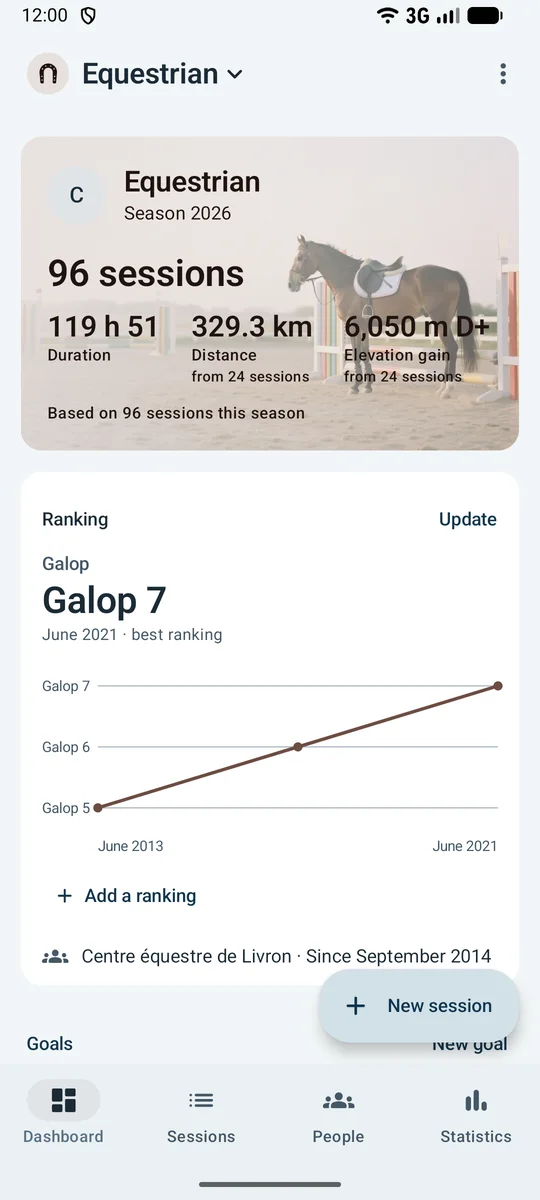
-
Idylle · Show jumping
The horse, then the discipline
Each session gives the horse ridden and the discipline: a name typed once comes back afterwards, and the discipline is kept from one session to the next. The logbook reads your season horse by horse.
-
- Leisure
- Dressage
- Show jumping
- Eventing
- Hunter
- Western
- TREC
- Endurance
- Combined driving
- Vaulting
10 equestrian disciplines
From leisure to vaulting: each discipline opens its own fields, penalties for show jumping, a percentage for dressage, points for TREC, a distance and a time for endurance.
-
- Trail ride
- Club lesson
- Groundwork
Club lesson, trail ride, groundwork
A club lesson records its instructor, chosen from your people; a trail ride records its distance, its elevation gain and its average heart rate, and the speed is worked out, breaks included.
-
- Halt
- Circle
- Serpentine
- Rein-back
- Leg-yield
- Shoulder-in
- Half-pass
- Extension
- Flying change
- Pirouette
- Piaffe
- Passage
- Paces
- Impulsion
- Submission
- Rider’s position
- Harmony
- General impression
18 movements and general marks
Each movement of the test is marked from 0 to 10, with its coefficient; paces, impulsion, submission, rider’s position and harmony are added. The best percentage is recorded test by test.
-
- Clear
- Knocked down
- 1st refusal
- 2nd refusal
- Eliminated
The course, fence by fence
Penalties, time allowed and time taken, height of the fences in centimetres, jump-off with its penalties and its time: the whole show jumping course is recorded.
-
Dressage · Cross-country · Show jumping
One line per phase
Eventing and combined driving record each phase, and the sum of the phases matches the competition total without replacing it. In TREC, the points of each event add up on their own into a total.
-
- Lameness
- Metabolic
- Overtime
An elimination gives its cause
In endurance, the speed is free or set, and the distance with the time taken gives the average speed. An elimination records its cause.
-
- Galop 1
- Galop 2
- Galop 3
- Galop 4
- Galop 5
- Galop 6
- Galop 7
Your Galops, each dated
The federal award is dated when you earn it, never recalculated by the competition. 7 other ladders are recorded too: Germany, Italy, Spain, the United Kingdom, the United States, Sweden and Belgium.
More than 3,100 ways to read your riding
21 ready-made analyses, and custom analysis: 90 indicators to cross with 35 criteria, as a breakdown or over time, with whatever filters you like.
- 21ready-made analyses
- 90indicators
- 35criteria
- 3,150possible combinations
- The time spent in the saddle with each horse
- Your average percentage in each dressage test
- Your best percentage, test by test
- The average mark of each movement, general marks included
- The fences cleared, knocked down or refused
- Your courses with no penalties and your penalised courses
- Your show jumping sessions, with or without a jump-off
- The share of the starters you beat, discipline by discipline
- Your average place by level of the event
- Your kilometres in the saddle, month by month
- Your average heart rate by discipline, from leisure to endurance
- Your endurance rides at free speed and at set speed
- Your endurance eliminations by cause
- Your average TREC total, season after season
- The total of the phases of your eventing, year after year
- Your sessions with each instructor
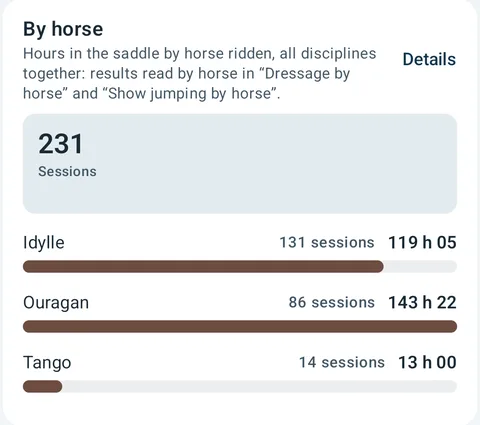
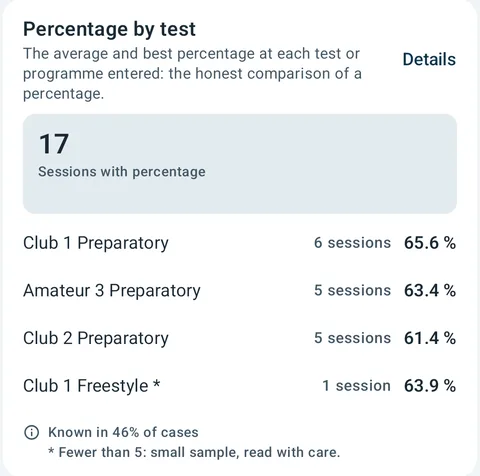
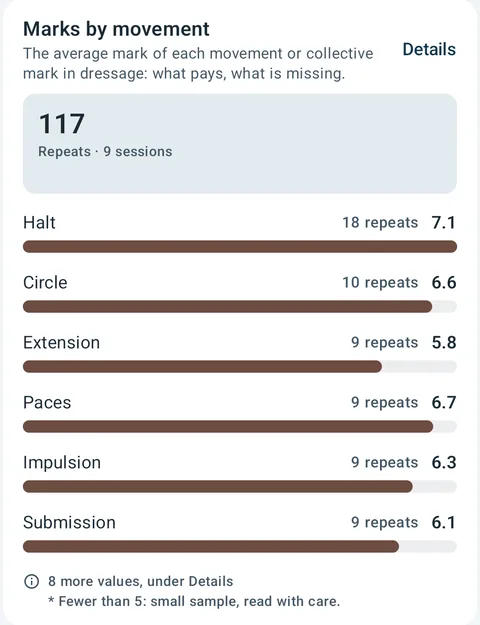
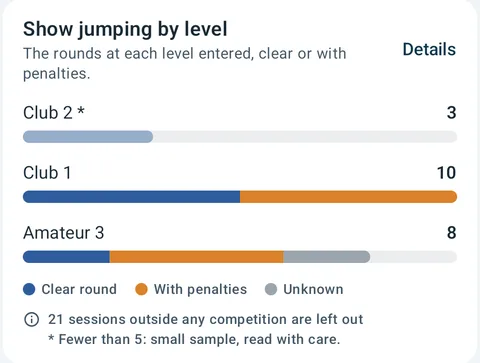
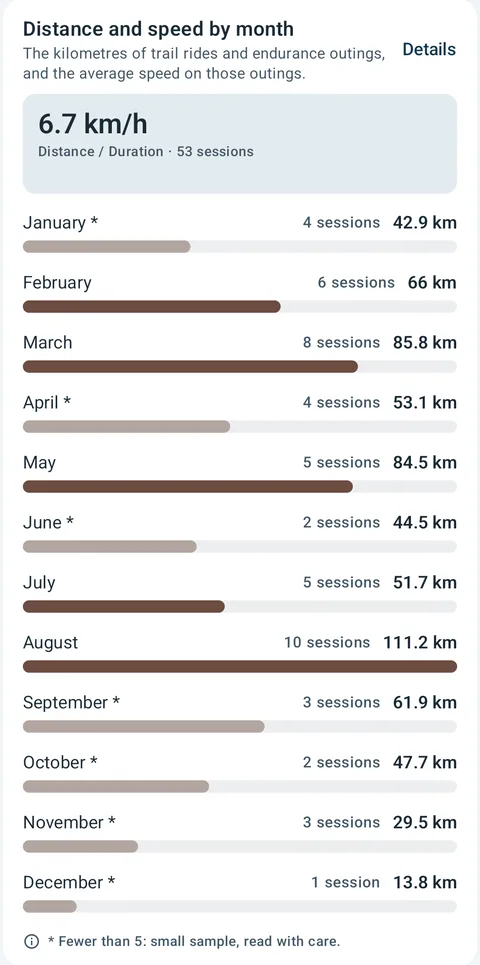
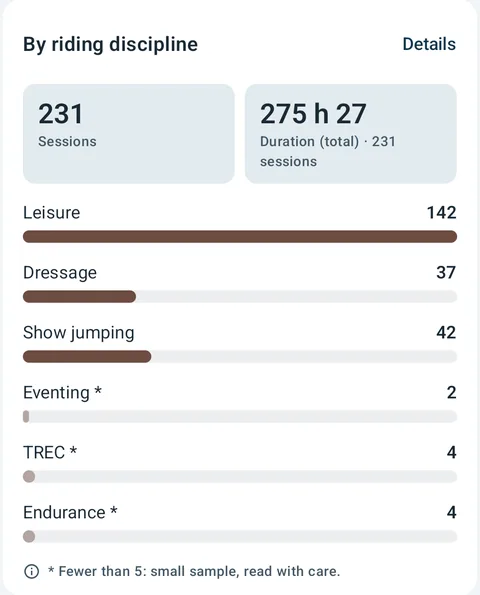
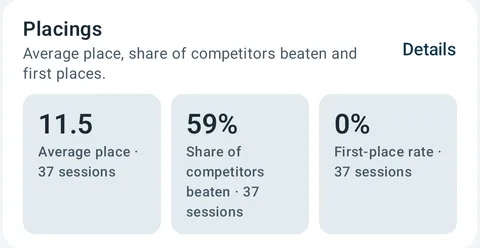
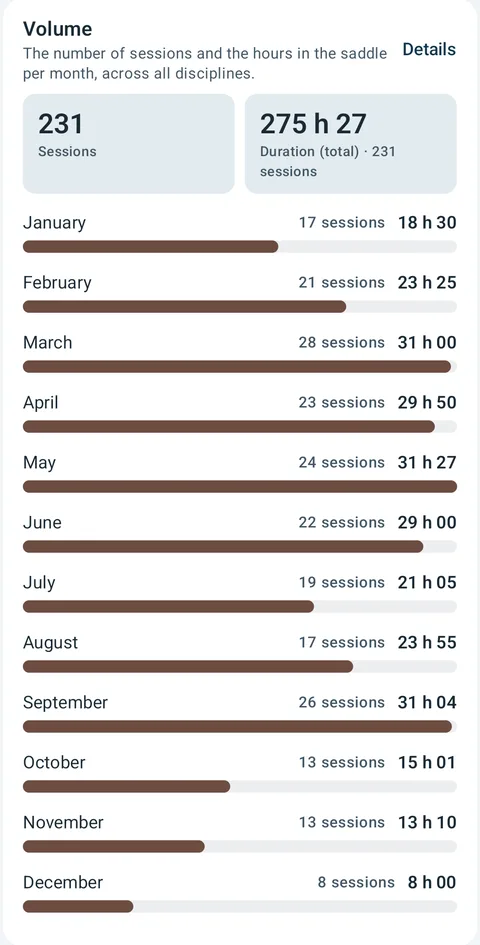
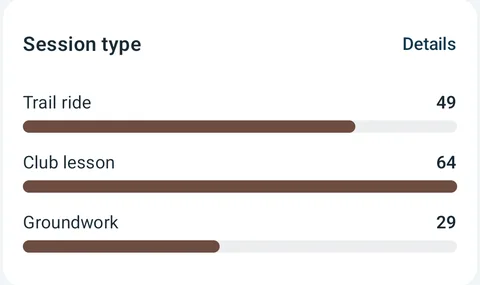
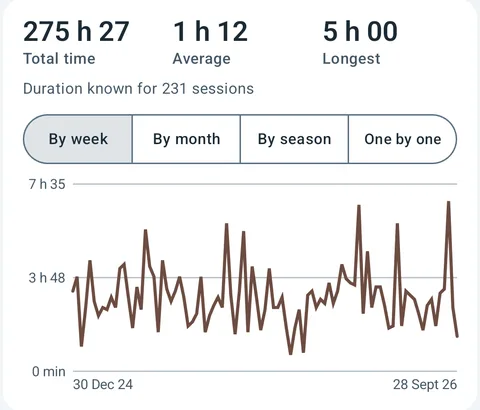
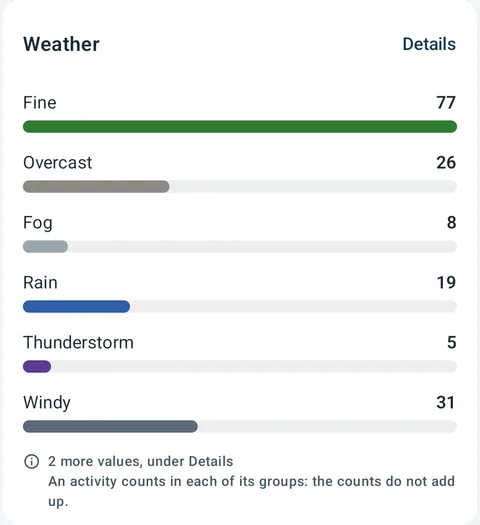
Tap a bar, a slice or a point: the sessions behind it open up. And every figure says how many sessions it is based on.
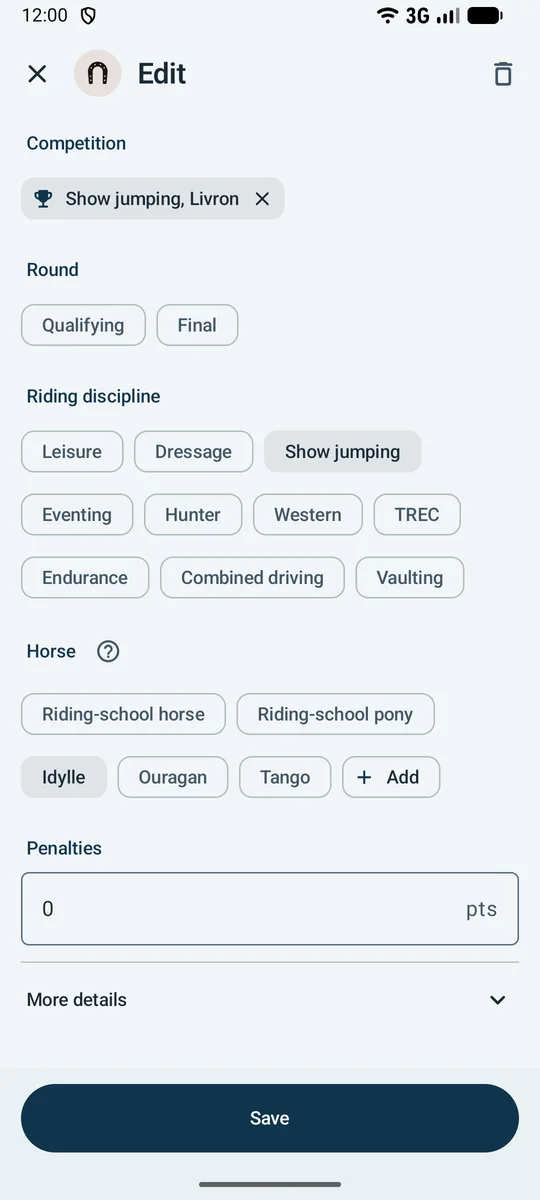
The horse, the discipline, the result
The horse and the discipline are up front, with the result of the discipline: the penalties in show jumping, the percentage in dressage, the total in TREC. In a competition, the competition and the round are added; the time, the jump-off, the level and the bib unfold.
- The discipline is kept from one session to the next, and each horse name typed once comes back.
- “Jump-off ridden” opens the penalties and the time of the jump-off.
- The fences, the movements or the phases are logged in lines, one by one.
- “Fill from a GPX file” takes the distance, the elevation gain and the heart rate of a trail ride.
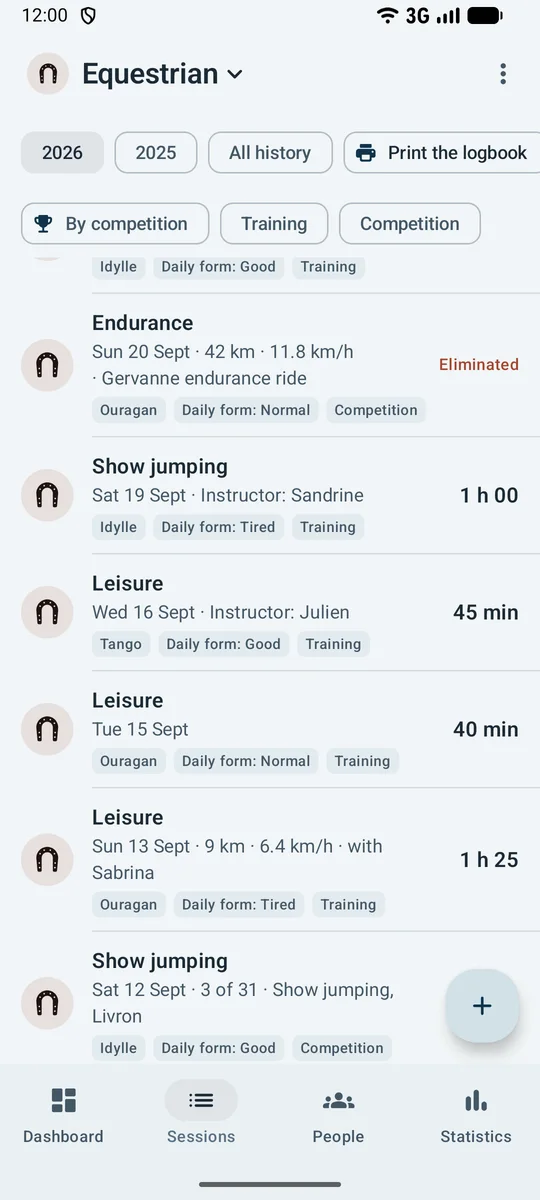
Your sessions, from the lesson to the competition
Each session gives its discipline, its horse, its instructor or its result and the form of the day; a competition gives its competition and its place among the starters.
- A competition is filed under its competition, with the events of the day.
- The best percentage is recorded test by test.
- An abandonment or an elimination reads on the session.
A season, horse by horse
“By horse” counts the hours in the saddle of each one; the dressage percentage and the show jumping read horse by horse too, without the disciplines mixing.
Outings, distance and heart rate
The trail ride and the endurance record the distance, the positive elevation gain and the average heart rate; the average speed is worked out from the time taken, or else from the duration of the session.
Everything equestrian brings to the logbook
Logging
- A date is enough, and the result when there is one: no required field
- Outcomes: did not finish, eliminated and did not start
- Training and competition
- Riding discipline (10), session type (3), horse, instructor, penalties, percentage, TREC total, test or pattern (6), distance, elevation gain, average heart rate, time allowed…
- “Next session” starts the next one with the same settings
Events
- Show, individual championship and team championship
- Rounds: qualifying and final
- Circuit
Rankings
- 8 systems: Galop, RA, Riding authorisations (Italy), Galopes (Spain), Pony Club Tests (UK), USPC certifications (US), Ryttarmärken (Sweden) and LEWB badges (French-speaking Belgium)
- Galop: Galop 1 to Galop 7, 7 steps
- Dated rankings, best ranking and its date, a curve
Records and markers
- Records announced the moment they fall: percentage
- Last time, recalled as you log, for each “test or pattern”
Watch and files
- Sessions from your watch, filed from Health Connect
Statistics
- Record, form, streaks, season-by-season trends; custom analysis on any field
- By riding discipline
- By horse
- Dressage by horse
- Percentage by test
- Dressage percentage by season
- Marks by movement
- Penalties
- Show jumping by level
- Show jumping by horse
- Jump-offs
- Distance and speed by month
- Volume
- Finishing positions
- Training or competition
- Calculated: Phase total
- Calculated: Average speed
- Every figure says how many sessions it is based on
And across the whole logbook: goals and a companion, private groups of friends, body, finances, a one-file archive, CSV spreadsheet, a printed logbook as PDF. No account, no ads, no audience tracking.
Riding, and everything else you do
Do you also hike, run, or ski in winter? Each discipline has its own space in the same logbook, with its own words.
Free, with Premium
Logging and data are free, without limit. Free statistics cover your last 20 sessions; Premium opens your whole history.
Get it on Google Play Coming soon to the App Store