
 Skateboarding, by Orma Logbook
Your skateboarding.
The tricks tried and landed, with their position and obstacle, your contests by heat score, your downhill runs on the clock and your cruises by the kilometre. In a logbook that holds your other sports too.
Get it on Google Play Coming soon to the App Store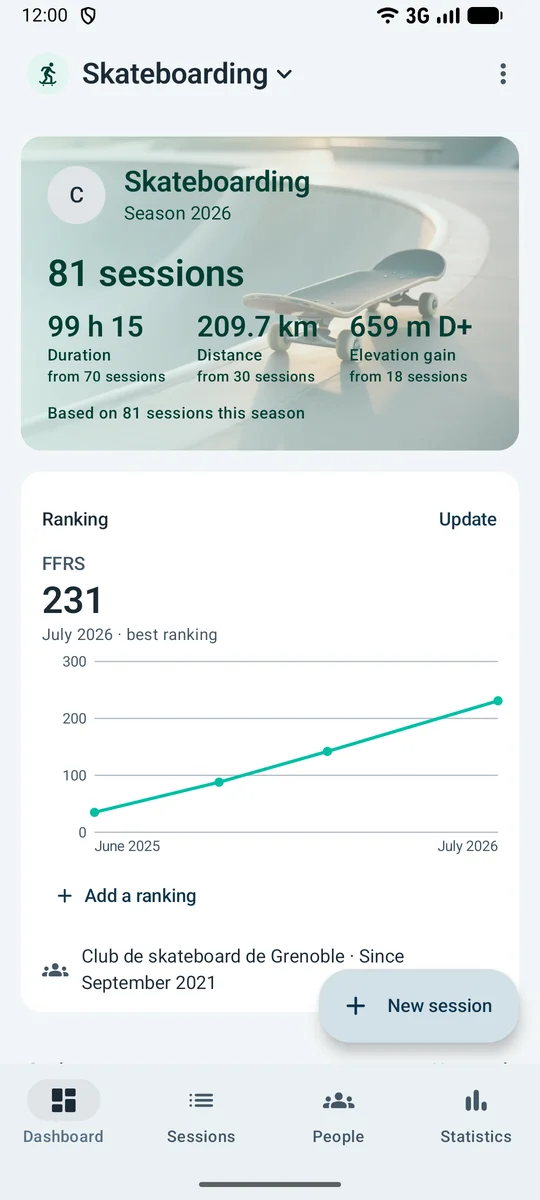
-
100 · 300
The heat score, out of 100 or 300
In park, your best run, out of 100; in street, your best run and your two best tricks, out of 300. Each run and each trick keeps its judge’s score, and the analyses by round separate the two scales.
-
- Street
- Park
- Vert ramp
- Freestyle
- Downhill
- Slalom
- Cruising
7 practices, from the street to the downhill
The practice opens its own fields: tricks for street and park, a distance for cruising, a time and a top speed for downhill.
-
- Regular
- Fakie
- Switch
- Nollie
4 positions for each trick
A switch kickflip is still a kickflip: the position and the obstacle are set, and the landing rate reads position by position. Your stance, regular or goofy, is noted once on your profile.
-
- Jumps · 1
- Flips · 3
- Slides and grinds · 3
- Manuals · 1
8 tricks, from jumps to manuals
Jumps, flips, slides and grinds, manuals: the list grows with your own tricks, each filed in its family.
-
- U10
- U13
- U17
- Open 17+
- Para
The FFRS circuit categories
The category is set on the contest and applies to each of its rounds. The World Skateboarding Ranking, and the FFRS national ranking, are entered separately, in points.
-
61.8 km/h
Downhill, on the clock
A run is logged with its time, its top speed and its distance. The record for each road is kept, and the average speed works itself out.
-
- Skatepark
- Street spot
- DIY
- Indoor
4 spot types
Skatepark, street spot, DIY or indoor: the type fills in from the place chosen, and the landing rate of tricks reads spot by spot.
-
First landing
A trick in progress until it lands
Each trick you work on is a project until its first landing. A tre flip you have been retrying for months and a brand-new hardflip read in the same place.
More than 1,500 ways to read your skateboarding
16 ready-made analyses, and custom analysis: 60 indicators to cross with 26 criteria, as a breakdown or over time, with whatever filters you like.
- 16ready-made analyses
- 60indicators
- 26criteria
- 1,560possible combinations
- The number of times you landed each trick
- Your attempts at each trick
- Your tricks landed by family: jumps, flips, slides and grinds, manuals
- Your tricks landed by position: regular, fakie, switch or nollie
- Your tricks landed by obstacle: step, rail, ledge, gap, quarter, bowl, flat
- The number of different tricks you tried, month by month
- Your falls, month by month
- The average number of falls per session, spot by spot
- Your sessions at each spot
- The time spent on each practice: street, park, cruising, downhill
- Your leisure, training, friends and contest sessions
- Your best heat score in park (out of 100) and in street (out of 300)
- Your average place by round: qualifying, quarter-final, semi-final or final
- The best judge’s score you got on each trick in contests
- The kilometres of your cruises and downhill runs, month by month
- Your best downhill time on each road
- Your top speed on each road
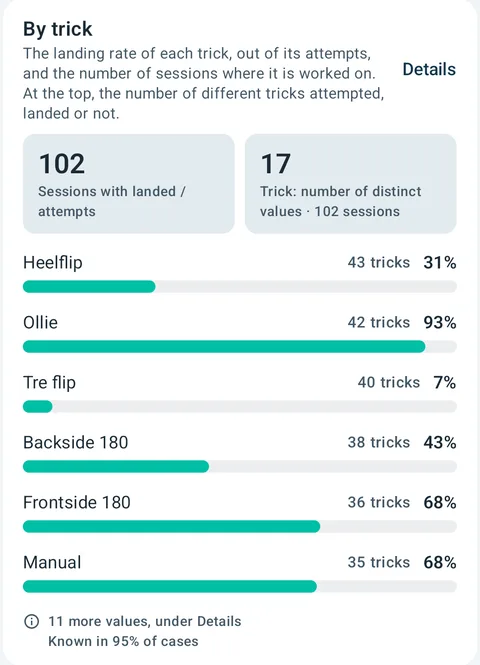
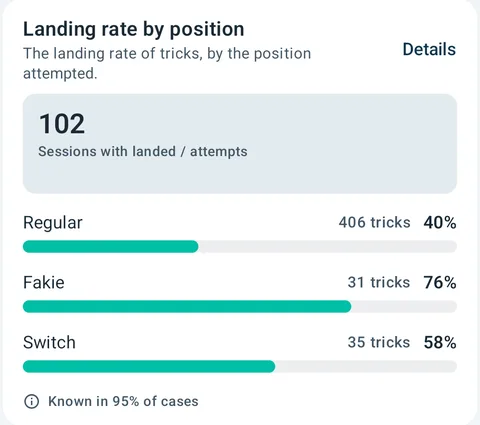
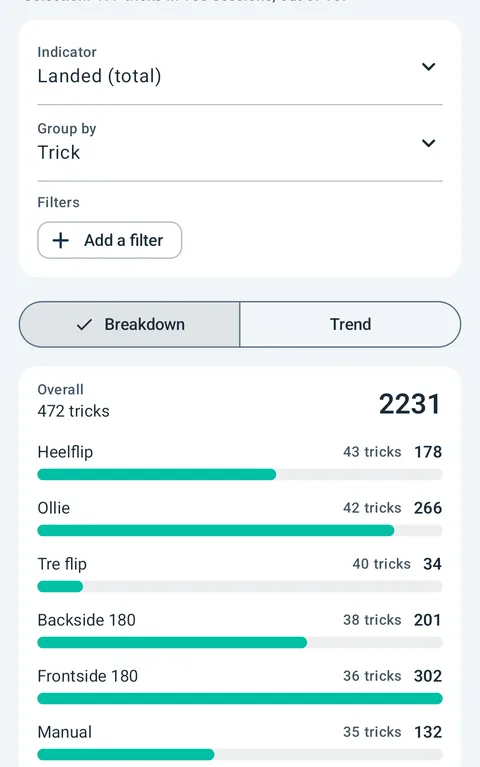
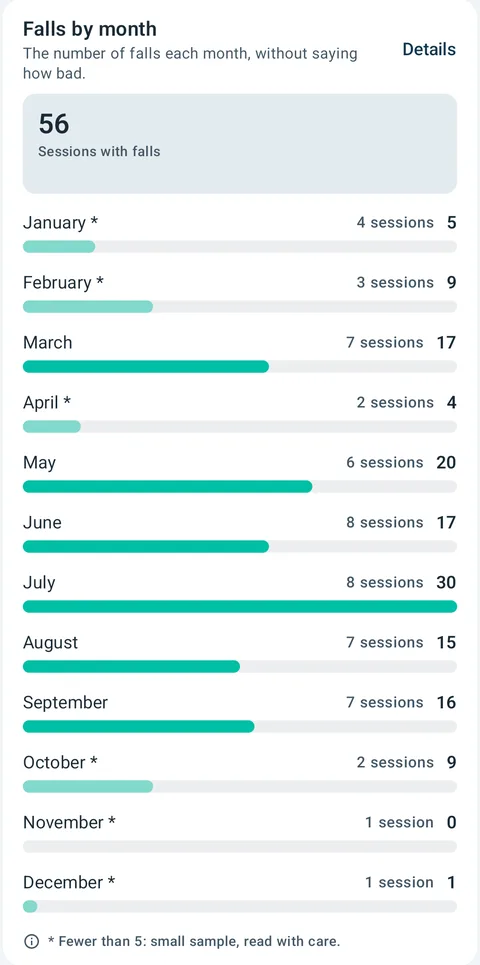
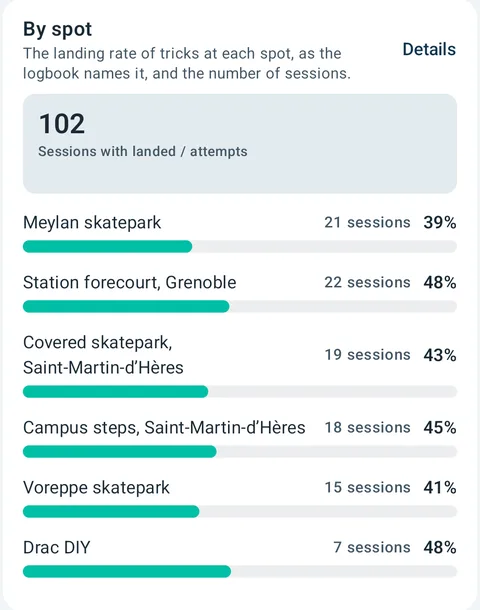
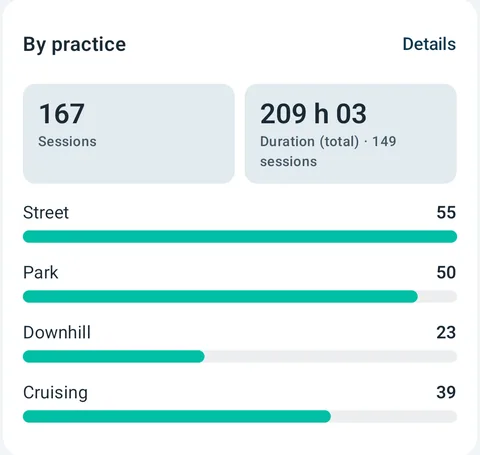
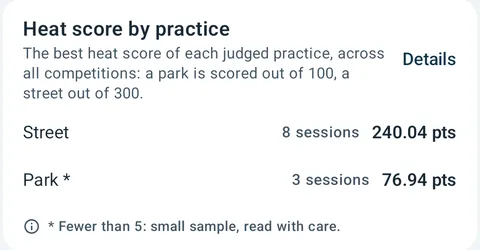
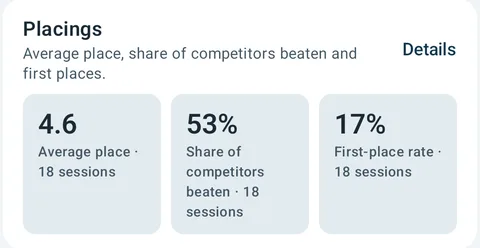
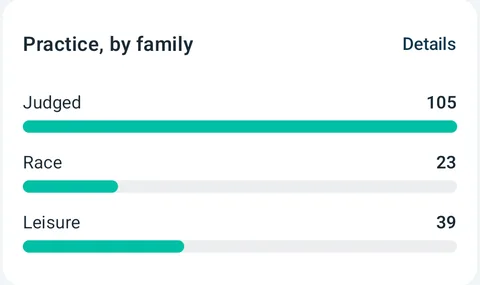
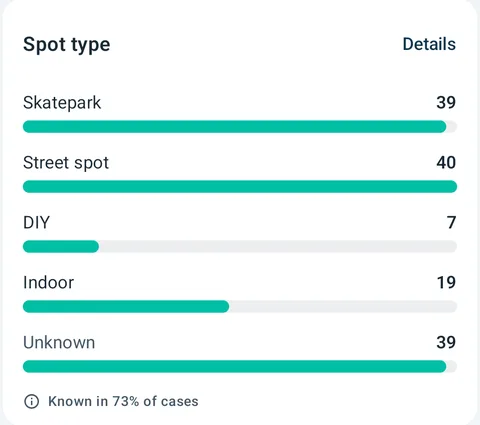
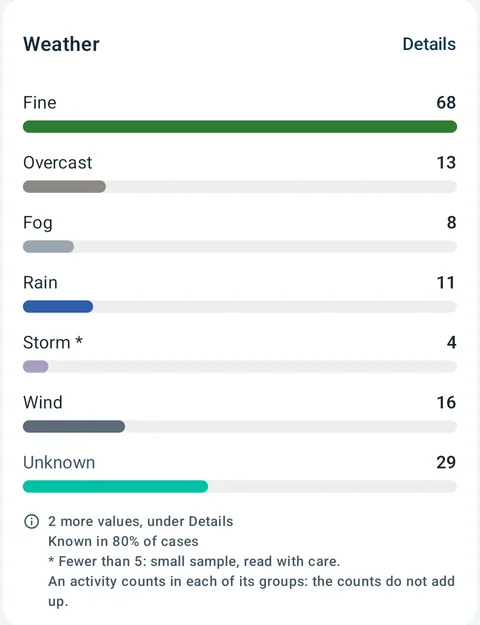
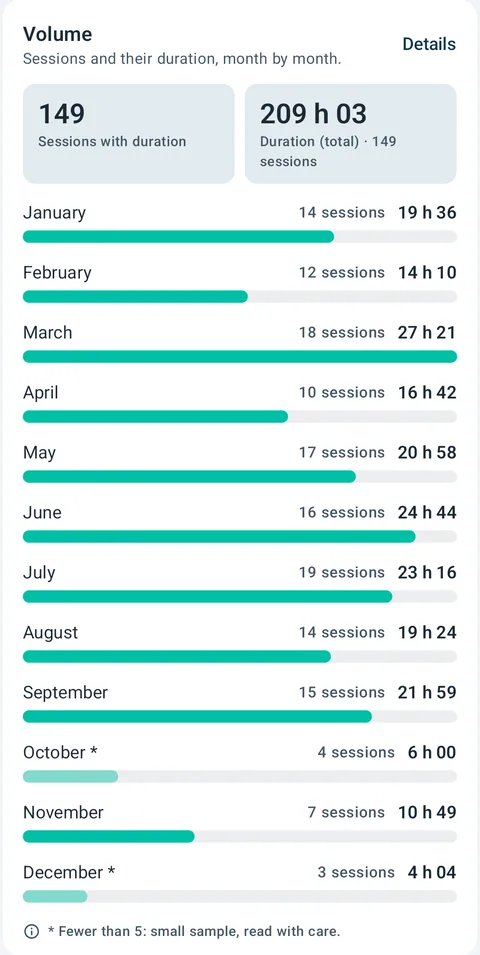
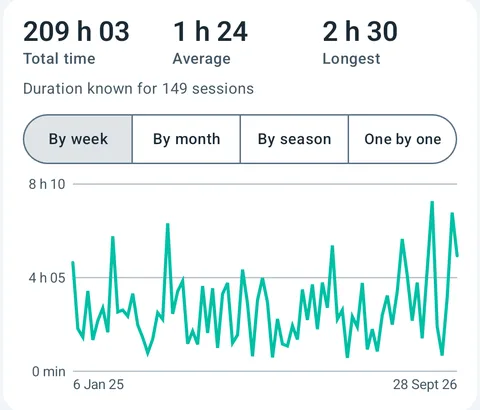
Tap a bar, a slice or a point: the sessions behind it open up. And every figure says how many sessions it is based on.
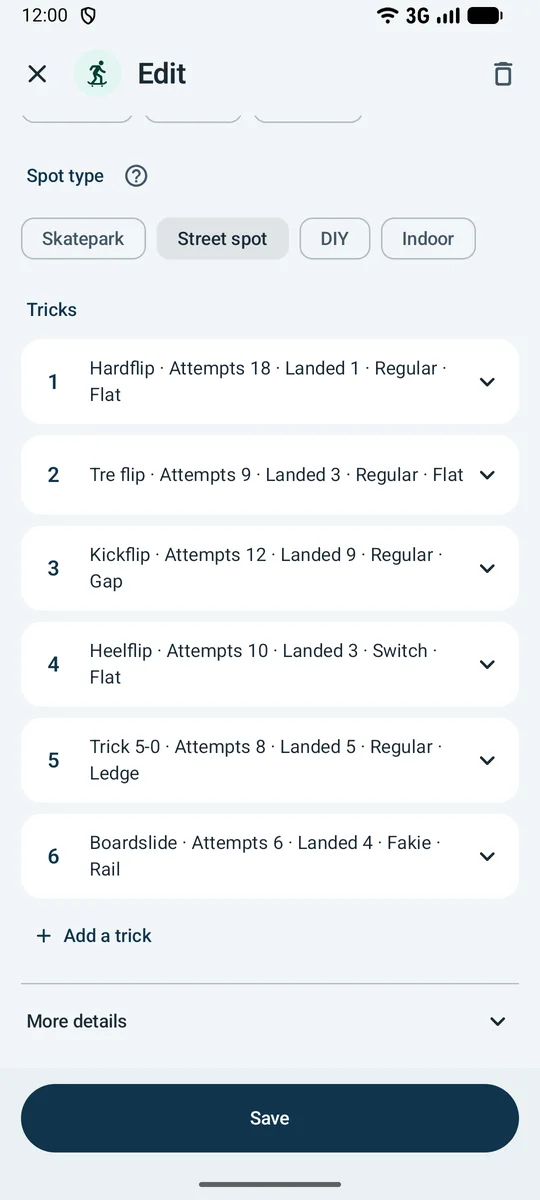
The practice, the spot, the tricks
You choose the practice and the spot, whose type fills in from the place; the tricks open straight away, each with its attempts and landings. Falls, crowd and daily form come after, under “More details”.
- The practice: street, park, vert ramp, freestyle, downhill, slalom or cruising.
- For each trick, its position, regular, fakie or switch, and its obstacle: flat, gap, ledge, rail.
- The spot type: skatepark, street spot, DIY or indoor.
- “More details” opens the contest, the round, the place, the weather, the crowd, the daily form and the falls.
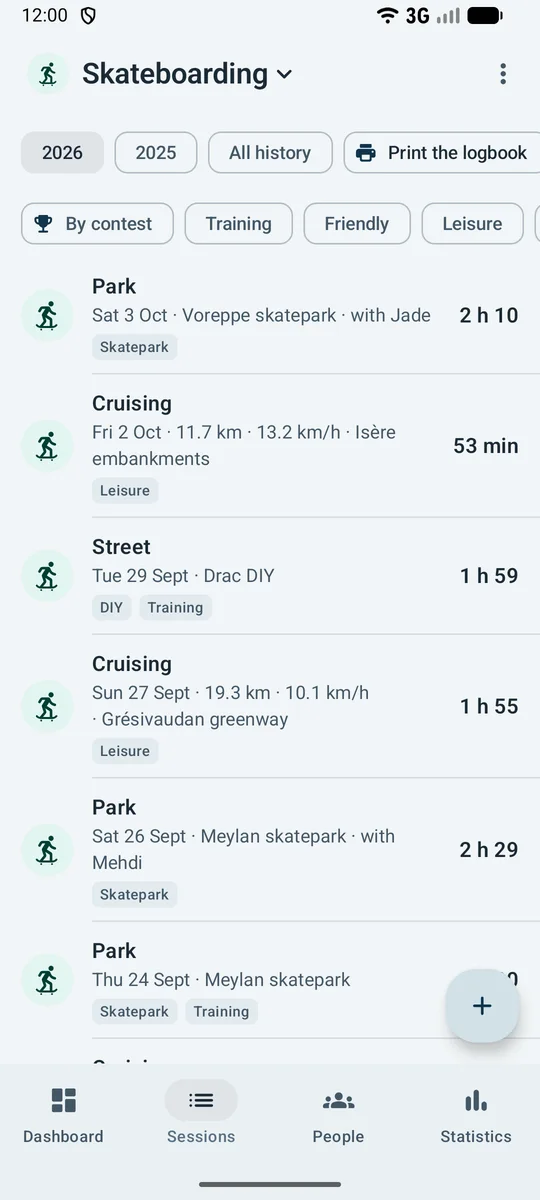
Your sessions, from the skatepark to the mountain pass
Each line gives the practice, the date and the spot, who you rode with, then what counts for it: the distance and speed of a cruise, the heat score of a contest. The duration is on the right.
- The average speed of a cruise, worked out from the distance and the time.
- The spot type and the session’s character as labels: skatepark, DIY, training, leisure.
- Contests kept apart, with one button, and “Print the logbook”: your session list as a PDF.
One date, one spot, and it is noted
A session is valid with its date and its spot; the tricks, the falls, the crowd and the daily form come when you feel like it. A cruise needs only its distance.
The run, the tricks, the heat score
In street, your best run and your two best tricks make the heat score, out of 300; in park, your best run, out of 100. Each judge’s score is kept, with the round and the place.
Everything skateboarding brings to the logbook
Logging
- A date is enough, and the result when there is one: no required field
- Outcomes: withdrew, no show, disqualified and did not start
- Training, friendly, leisure and official
- Practice (7), spot type (4), weather (8), crowd (5), daily form (3), falls, heat score, distance, elevation gain, average heart rate, top speed, time…
- “Next session” starts the next one with the same settings
Events
- Contest, championship and race
- Rounds: qualifying, quarter-final, semi-final and final
Rankings
- 4 systems: FFRS, WSR, IDF and ISSA
- Dated rankings, best ranking and its date, a curve
Records and markers
- Records announced the moment they fall: heat score, top speed and time
- Projects: each “trick” worked on, until you succeed
Watch and files
- Sessions from your watch, filed from Health Connect
Statistics
- Record, form, streaks, season-by-season trends; custom analysis on any field
- Volume
- By practice
- By trick
- Landing rate by position
- By spot
- Falls by month
- Heat score by practice
- By round · park
- By round · street
- Finishing positions
- Leisure or competition
- Calculated: Average speed
- Every figure says how many sessions it is based on
And across the whole logbook: goals and a companion, private groups of friends, body, finances, a one-file archive, CSV spreadsheet, a printed logbook as PDF. No account, no ads, no audience tracking.
Skateboarding, and everything else you do
Do you also ride BMX, roller skating, surf or snowboard? Each discipline has its own space in the same logbook, with its own words.
Free, with Premium
Logging and data are free, without limit. Free statistics cover your last 20 sessions; Premium opens your whole history.
Get it on Google Play Coming soon to the App Store