

 Running, by Orma Logbook
Your running.
Your best time over each distance, announced the moment it falls, your pace by session type, the kilometres on each pair of shoes, and your races with their bib and place. In a logbook that holds your other sports too.
Get it on Google Play Coming soon to the App Store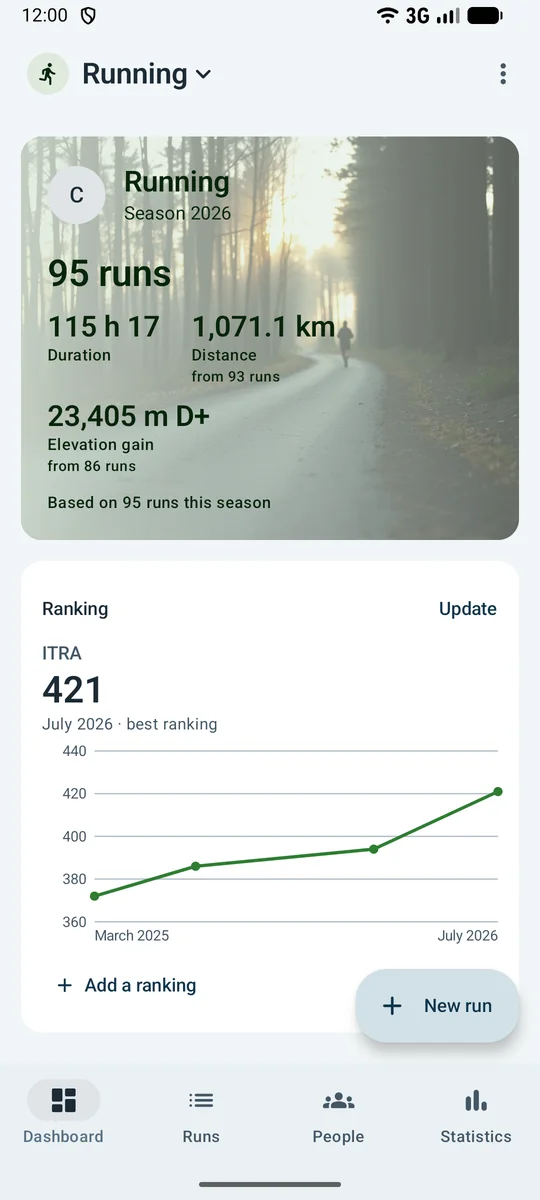
-
10 km · 41’58”
Your best time over each distance
The best time over 5 km, 10 km, 15 km, 20 km, half marathon, marathon and 100 km, to the second: a distance read on the watch counts in its band, so 10.2 km counts for a 10 km. The logbook announces “Personal best” the moment it falls.
-
- Easy run
- Recovery run
- Short intervals
- Long intervals
- Threshold
- Long run
- Hills
- Time trial or test
- Race
9 session types, from the easy run to the race
Easy run, short and long intervals, threshold, long run, hills, time trial: each type has its kilometres, its duration, its heart rate and its average pace in the statistics.
-
4’09”/km
The pace is worked out, never typed in
Distance and duration are enough: the pace shows on the run’s line, to the minute. With the time of a race, it is worked out to the second.
-
- Road
- Trail
- Cross-country
- Track
- Treadmill
5 surfaces, from the treadmill to the trail
The surface is noted up front, with the elevation gain for everything off the treadmill. Race records do not count the treadmill, the trail or cross-country.
-
- Road shoes
- Trail shoes
- Spikes
The kilometres on each pair
Road, trail and spikes to start with, your own models after that; the pair from your last run carries over by itself. The kilometres read pair by pair.
-
1,650 m D+
Elevation, climbed and descended
Elevation gain up front, then elevation loss and high point. The total climbed reads month by month, and the biggest climb of each session type in “Longest outings”.
-
- U23
- Senior
- M0
- M1
- M2
- M3
Your race: place, category, bib
Your place among the finishers, the place in your category, the bib. The FFA category, from athletics discovery to M10, carries over from the race. “Did not finish” is noted too.
-
ITRA · UTMB
ITRA, UTMB, Running Stones
Your ITRA index, your UTMB Index (general, 20K, 50K, 100K, 100M) and your Running Stones are noted with their date: the logbook records the value read on the site, it does not recalculate it.
More than 900 ways to read your running
14 ready-made analyses, and custom analysis: 51 indicators to cross with 19 criteria, as a breakdown or over time, with whatever filters you like.
- 14ready-made analyses
- 51indicators
- 19criteria
- 969possible combinations
- Your kilometres, month by month
- Your kilometres, week by week
- Your cumulative elevation gain, month by month
- The number of runs of each session type
- The kilometres on each pair of shoes
- Your best time in each distance band
- Your average heart rate by session type
- Your longest run for each session type
- The biggest elevation gain in one run, on each surface
- Your average place by race type
- The share of competitors you beat, year after year
- Your best category place, year after year
- Your runs by day of the week
- Your average cadence by session type
- The average distance of your runs, by weather
- The kilometres you ran in each place
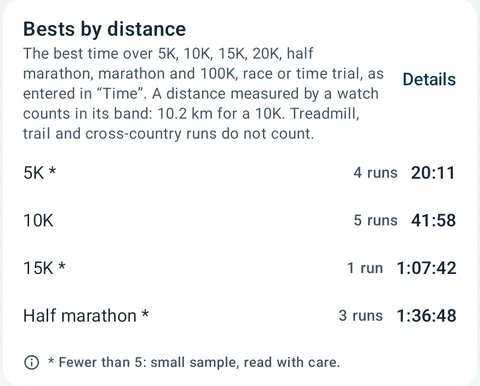
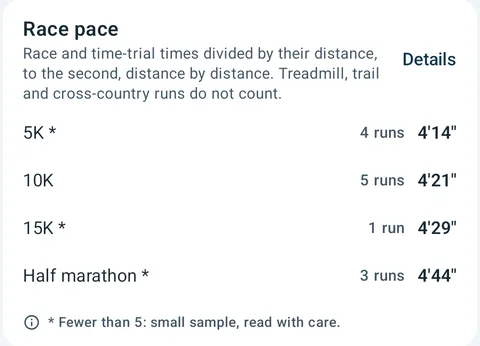
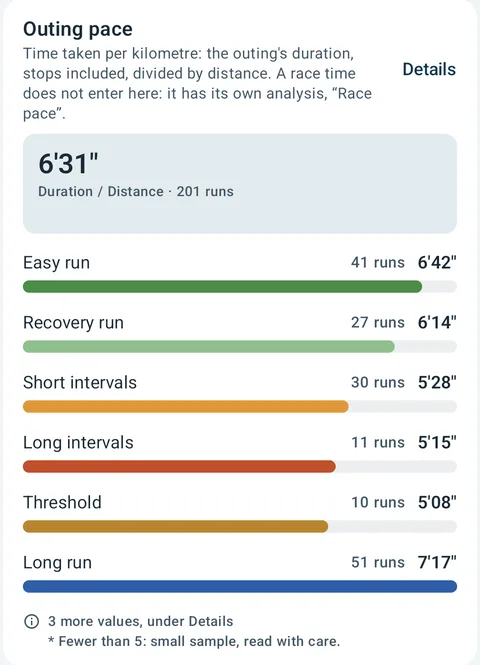
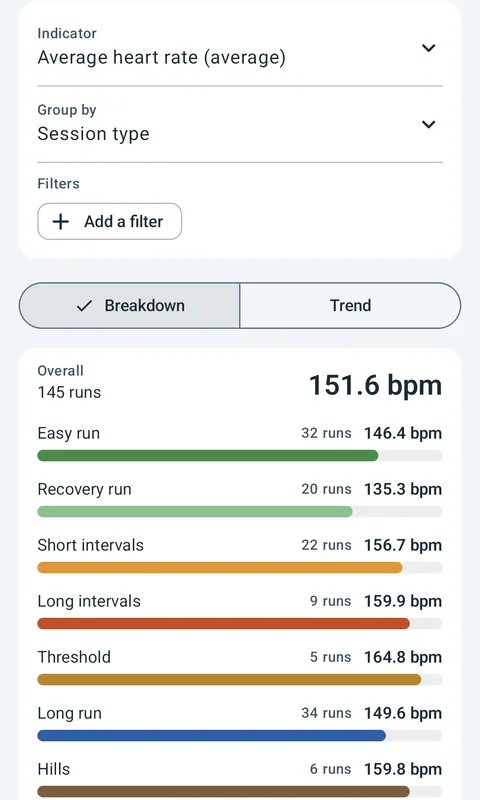
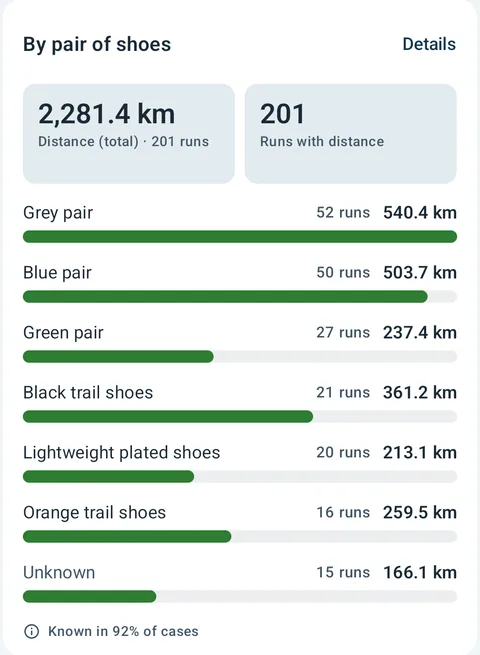
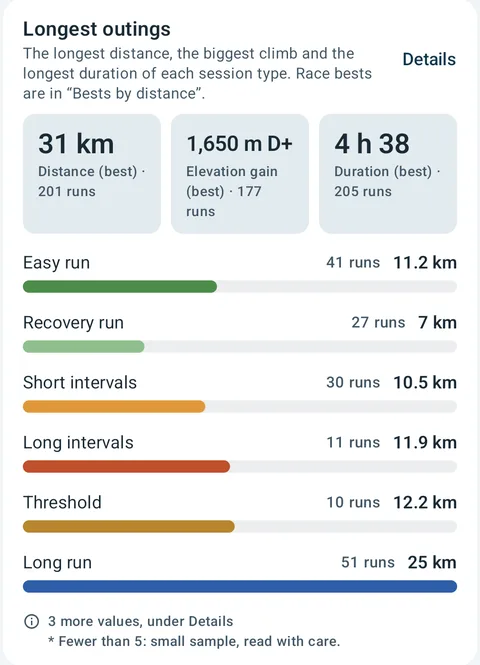
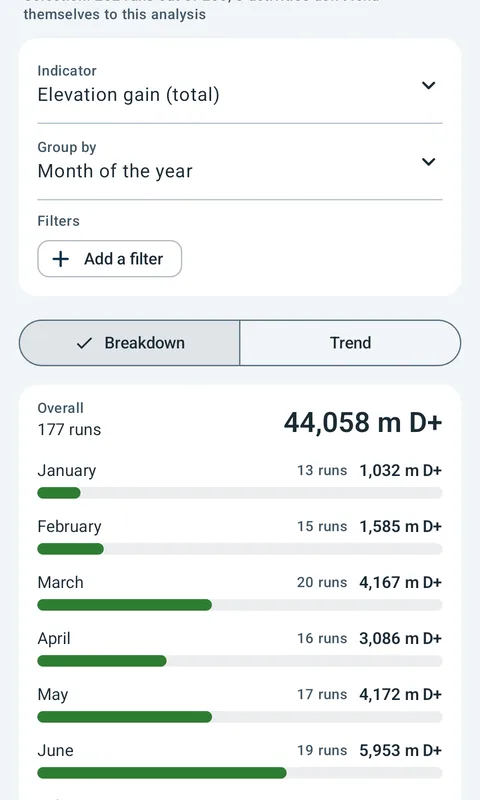
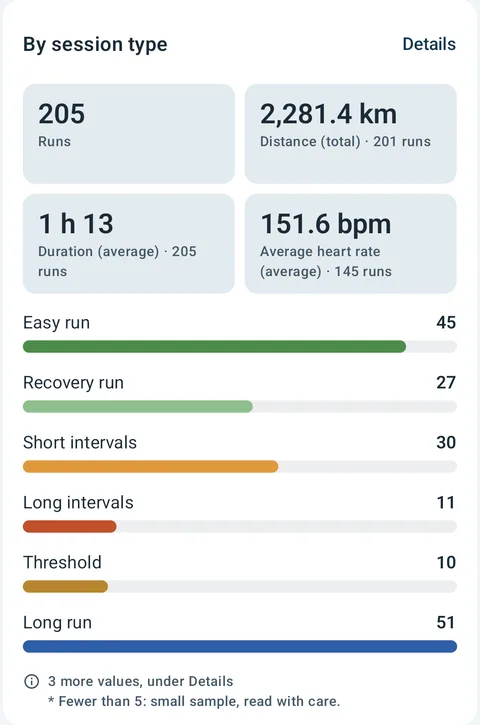
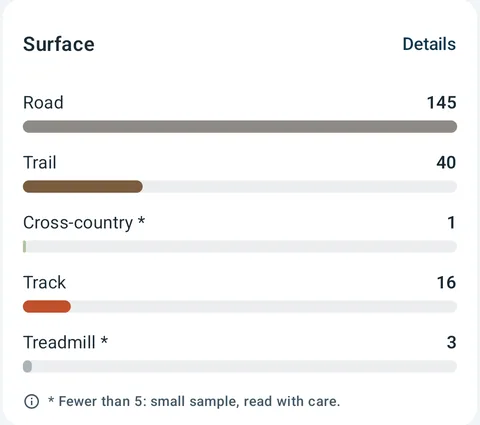
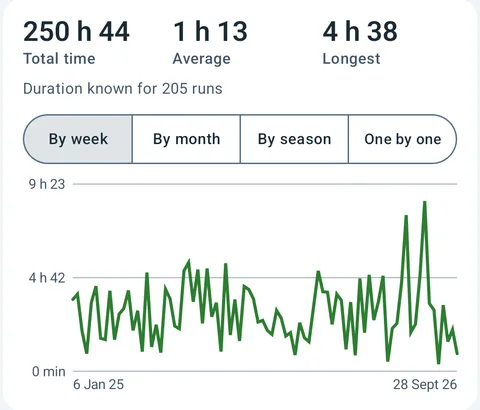
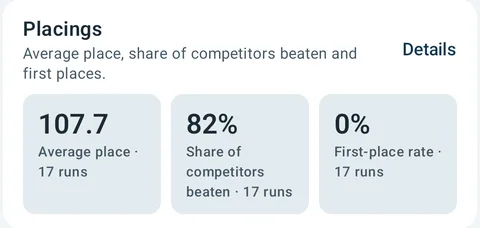
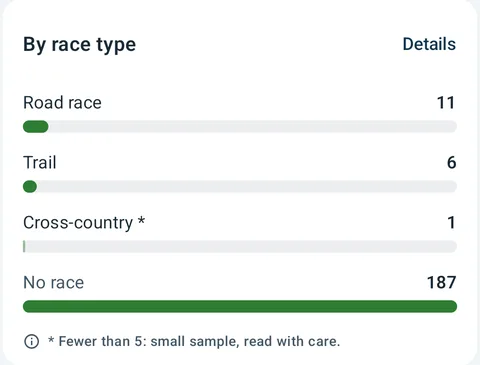
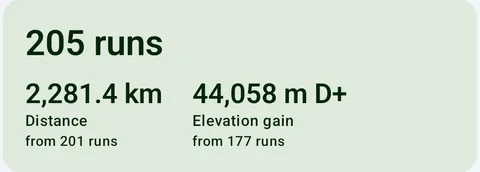
Tap a bar, a slice or a point: the runs behind it open up. And every figure says how many runs it is based on.
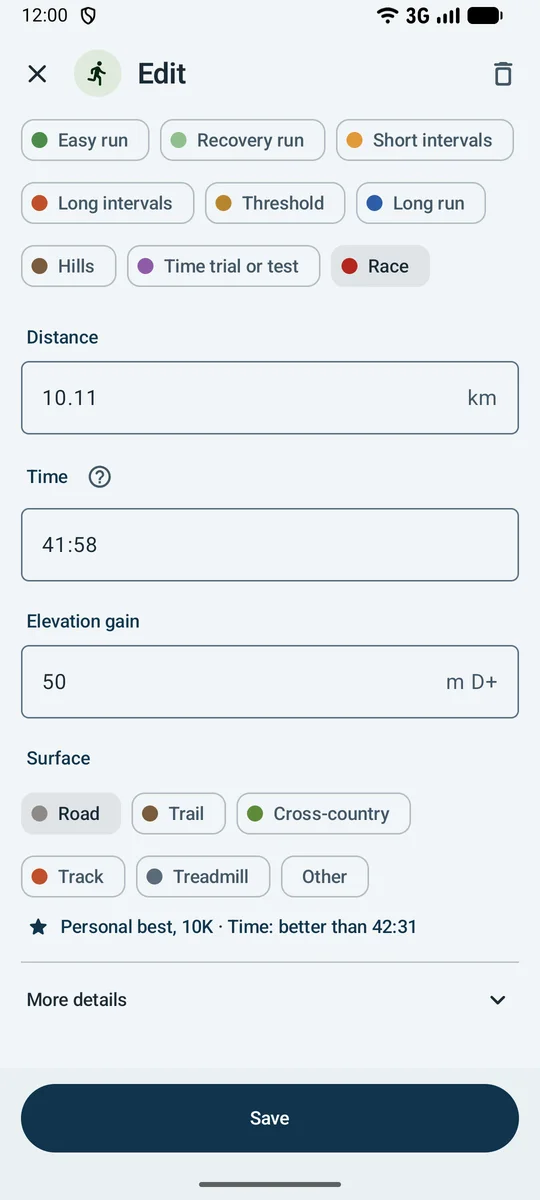
The type, the distance, the time: that is all
The session type, the distance, the elevation gain off the treadmill and the surface are all up front; the time is added for a race or a time trial, and the pace is worked out.
- From easy run to race, through intervals, threshold, hills and long run.
- The time of a race to the second: “4158” makes 41’58”, and “Personal best” appears under it.
- The pair of shoes from your last run carries over by itself.
- “Fill from a GPX file” takes the times, distance, elevation and heart rate from a GPX or TCX file, without overwriting what you typed.
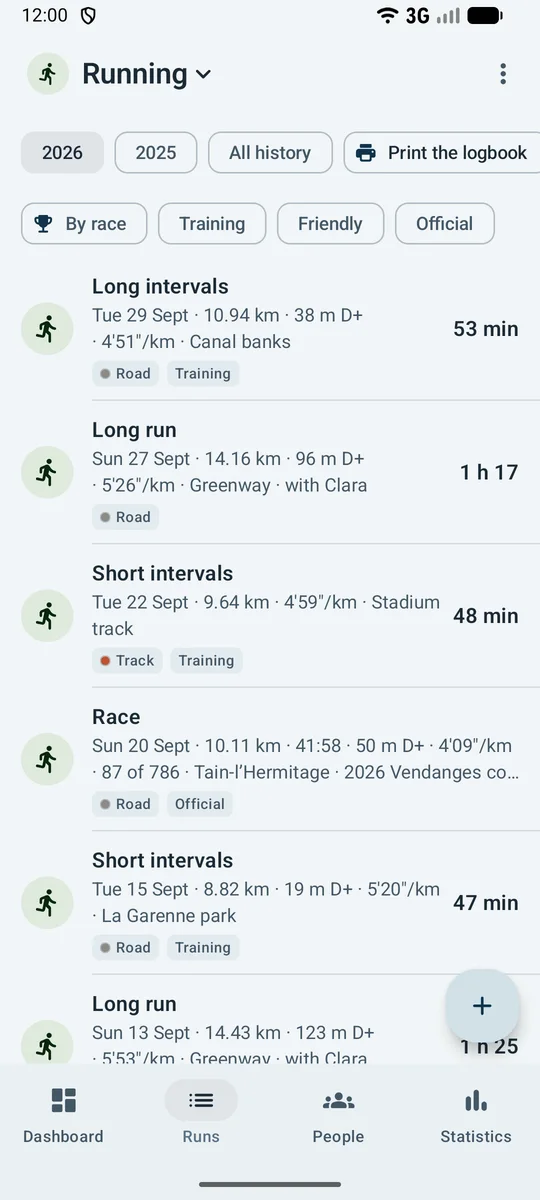
Your runs, with their pace
Each run shows its session type, distance, elevation gain, surface and kind; a race adds its time, and its place is on its own sheet.
- Races have their event type: road, trail, cross-country, vertical kilometre, skyrunning, ultra-trail, canicross…
- The place among the finishers, on the race’s sheet.
- The kind (training, friendly or official) shown as a tag under each run; the feeling appears when you have noted it.
- A run you did not finish carries the mention “Did not finish”.
A distance, a time, and it is noted
A run counts with its date, distance and duration; the session type, elevation gain, heart rate and feeling come when you want them. “45 minutes of easy running” with no distance can be logged too: the pace then stays unknown.
The volume, week after week
Runs, kilometres, elevation gain and time spent, week by week and month by month, with the number of runs each total is based on.
Everything running brings to the logbook
Logging
- A date is enough, and the result when there is one: no required field
- Outcomes: did not finish and did not start
- Session type (9), distance, time, elevation gain, elevation loss, high point, surface (6), shoes (3), average cadence, average heart rate, maximum heart rate, weather (9)…
- “Next run” starts the next one with the same settings
Events
- Road race, trail, cross-country, track race, vertical kilometre, skyrunning, mountain race, ultra-trail…
Rankings
- 7 systems: ITRA, UTMB, UTMB 20K, UTMB 50K, UTMB 100K, UTMB 100M and Stones
- Dated rankings, best ranking and its date, a curve
Records and markers
- Records announced the moment they fall: time
Watch and files
- Sessions from your watch, filed from Health Connect
Statistics
- Record, form, streaks, season-by-season trends; custom analysis on any field
- Bests by distance
- By session type
- By pair of shoes
- Volume
- Weekly volume
- Outing pace
- Race pace
- Longest outings
- Calculated: Pace
- Every figure says how many runs it is based on
And across the whole logbook: goals and a companion, private groups of friends, body, finances, a one-file archive, CSV spreadsheet, a printed logbook as PDF. No account, no ads, no audience tracking.
Running, and everything you do besides
Do you also cycle, swim or hike? Each discipline has its own space in the same logbook, with its own words.
Free, with Premium
Logging and data are free, without limit. Free statistics cover your last 20 runs; Premium opens your whole history.
Get it on Google Play Coming soon to the App Store